California Department of Fish and
Wildlife
Marine Biogeographic Information and
Observation System
MarineBIOS Data Viewer User Guide (Beta)
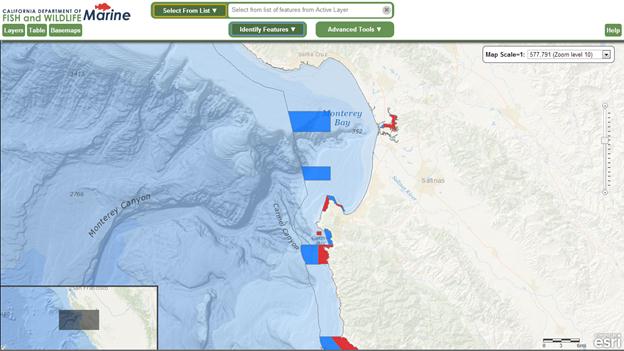
Upon web map
viewer startup, a welcome screen provides you with information about the viewer,
possible use restrictions and links to additional information.
Project
Banner
In the top
left corner of the viewer is a banner area that includes the CDFW logo and the
project banner.
![]() Clicking on the CDFW logo in the banner will
take you to the California Department of Fish and Wildlife homepage.
Clicking on the CDFW logo in the banner will
take you to the California Department of Fish and Wildlife homepage.
![]() Clicking on the Marine
logo in the banner will take you to the Marine Region homepage.
Clicking on the Marine
logo in the banner will take you to the Marine Region homepage.
Table of
Contents (TOC) - In the left side panel is the Table of Contents. The
Table of Contents lists the data layers that are available to the particular
viewer by default and the available basemaps. The TOC also provides other map
content related functionality, such as displaying the metadata and symbology
for your data layers.
If the TOC Panel is collapsed it can be made
visible again by clicking on one of the tabs on the toolbar such as the Layers tab or the Basemaps
tab. If it is open and you wish to close it you can do so by clicking on the
close (x) button on the upper-right corner of the panel. You can switch the
contents of the panel by clicking the different tabs on the toolbar. Clicking
on the tab that is already 'on' will close the panel.
The Table of Contents
panel may include the following contents:
- Layers - This tab is active by default
in the TOC panel. It displays a list of all the current map content with
the exception of the background map.
![]()

- To
draw a data layer, simply check on the small box to the left of the name
of the data layer in the Table of Contents. We have some very large and
complex datasets in MarineBIOS, so we do not draw them automatically when
they are loaded into the map. This gives you a chance to zoom in to your
area of interest first improving both the performance of the viewer and
the legibility of the data.
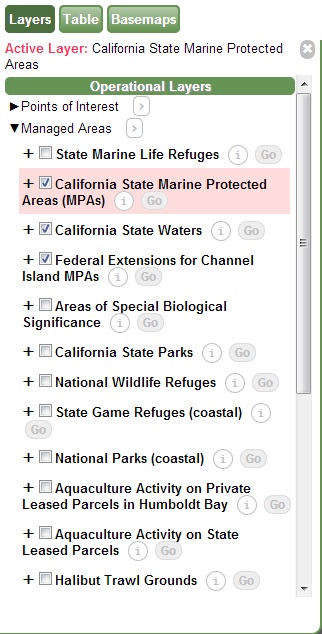
- Click
on the layer name in the Layers tab of the Table of Contents to activate the layer or select it as the current Active Layer. This makes the layer available for use
with the various tools in MarineBIOS. You will see a pink box appear
around the layer indicating that it is active and the name of the layer
will show in the Active Layer display.
- You
can view the metadata document for the layer by clicking on the Info (i) button to right
of the layer name.
- The
Go
button will allow you to quickly zoom the map to the full spatial extent
of the Active Layer.
- A symbology
legend is available for each data layer in the Layer tab. Click on the + to the left of the Layer name
and check box and a drop-down legend will appear below the layer name
showing each type of symbol used to display that dataset in the map.
Feature symbology is not editable in MarineBIOS at this time.
·
Graphics
and Selections - This section lists
any graphics layers that you have created in your map, such as map labels, as
well as any selections that you have created while working with the layers and
tools.
- Reference
Layers - This section lists
the general purpose map layers that are provided for geographic reference.
These include layers for cities, place names, county boundaries, USGS
Quads, and US Township/Range/Sections. By default, the Point Info tool uses
these layers to display general location information about a point that
you clicks on the map.
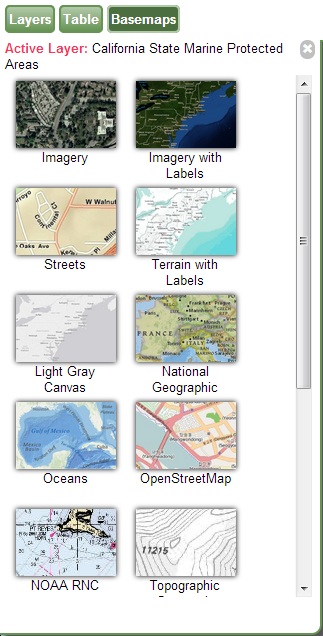
- Basemaps - You can change the background
map to any map available under the Basemap tab in the Table of Contents on
the left side of the viewer window. Choices include imagery, street maps,
topographic maps and several years of NAIP imagery, among other options.
The default basemap that is loaded when the viewer opens is the ESRI Oceans
Map.

·
 Table –
Between the Layers tab and the Basemaps tab in the Table of Contents you will find
the Table tab.
Table –
Between the Layers tab and the Basemaps tab in the Table of Contents you will find
the Table tab.
This tab will open and close the collapsible
data panel along the bottom border of the viewer. When you search for a layer
feature by using the Search Active Layer
Quick Tool or select features using the Select tool, valid results will be
displayed in a table format in this Table panel. No more than 300 records will
be displayed in the Table panel.
·
Active
Layer Display - Along the top of the Table of
Contents panel and just below the Layers tab is a small display showing the
currently selected Active Layer.
Tools that interact with the data
layers will work only on the Active Layer. To make a layer active you simply
click on the layer title. You will see a pink box appear around the layer
showing that it is active and the name of the layer will show in the Active
Layer display.
Map Canvas
In the
center spanning the most of the page height and width is the map canvas. This
is where map layer data will be displayed where you can interact with the data by
using the tools provided. Panels that run along the side of the viewer (side
panels or sidebars) can be closed to reveal a large map area.
![]()

![]()

![]()
![]()
- Zoom Slider- Zoom in and out of the map view by
clicking on the bar or hold mouse down and drag the slider up or down the
bar.
- Scale
Bar
- The map scale bar along the bottom right of the map next to the Esri
logo shows the current map scale in miles distance.
- Overview Map - The overview
map lies on the bottom left corner of the Map Canvas and offers a broader
overview of the current map view extent. Upon first opening the map
viewer, the Overview map may be hidden. Click on the little arrow at
the lower left corner to expand it. The overview map may be hidden by the Table
panel when the Table panel is open.
MarineBIOS Tools
All of the tools from
the previous version of the MarineBIOS viewer are still available in the new
version. They have been arranged into the three drop-down menus that you see at
the top of the viewer.
To use a tool in MarineBIOS, you must first
select the layer that you want to use the tool on in the Layers tab of the
Table of Contents on the left side panel of the viewer, making it the Active
Layer. Once you have an Active Layer to work with you can select and use your
tool. The current Active Layer is
indicated by a solid pink box around the layer name in the Layers list.
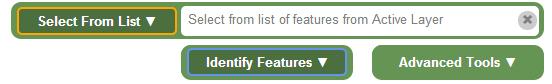
Quick
Tools Menu
On the
top center of the viewer, next to the logo area is the Quick Tools menu. Here
you will find tools that interact with the text box to the right of the menu to
perform various tasks. Results may be displayed in an automatic drop-down
selection list directly below the input text box. Click on the Quick Tools drop-down
to see a list of available tools.

![]()
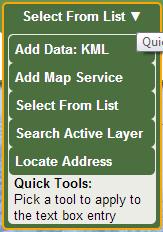
- Add Data: KML Tool – This tool allows you to add a publicly
accessible dataset that is formatted as KML (Keyhole Markup Language) or
KMZ (zipped or compressed KML files) to your BIOS session. Select the Add
Data: KML tool and then enter the URL into the Quick Tool menu input box
and press the Enter key on your keyboard.
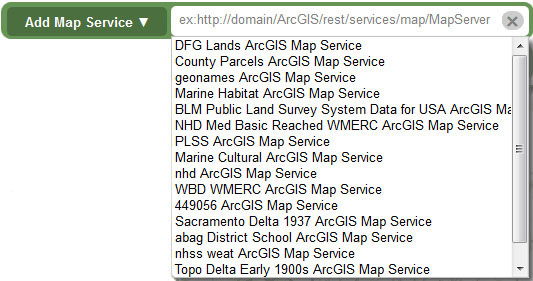
![]()
- Add Map Service Tool – This tool allows you to add any
publicly accessible ad hoc map data source in the format of an ArcGIS
Server REST Map Service. Select the Add Map Service tool, enter the URL
into the Quick Tool menu input box and press the Enter key on your
keyboard. The Map Service will be added to the Layers tab in the Table of
Contents and will draw in the Map Canvas.
-
NOTE: Some functionality will be limited if the map service coordinate system /
spatial reference is not in Web Mercator (wkid=102100, conforming to
ArcGIS.com/Bing/Google Maps).
- Select from List (of Feature
Names) Tool - This tool queries the current active
layer for a list of feature names and returns them as a list. If the immediate
result for the entire feature layer is less than 500 features, then all of
the names are listed in a drop-down list under the quick text box.
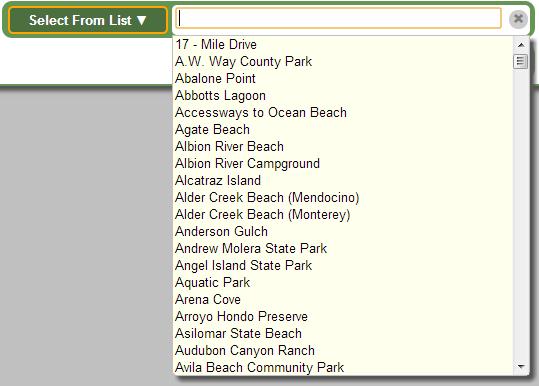
You
can also type something directly into the quick input box and the list will be
dynamically filtered to match the search term that you have entered. Click on a
feature in the list and the map will zoom to it and display the corresponding
attribute information for that feature in a pop-up window in the Map Canvas.
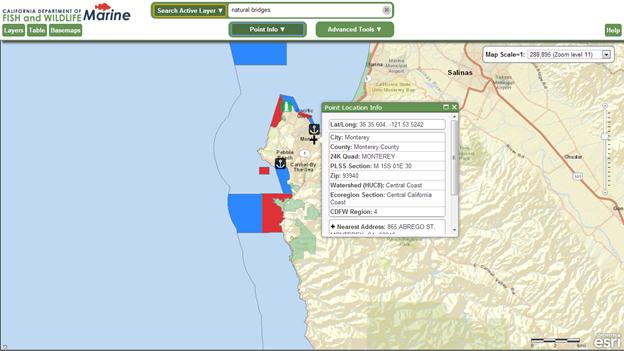
- Search Active Layer Tool – This tool allows you to search
for features in the current Active Layer by attribute values.
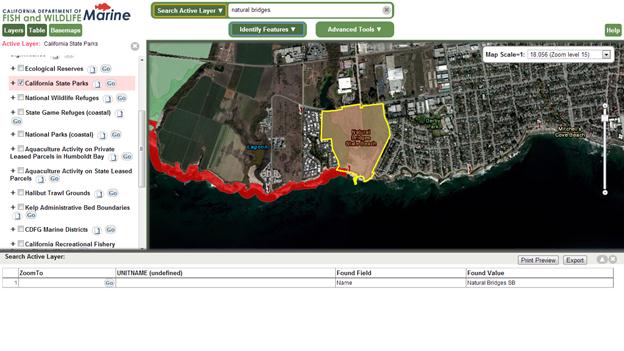
First
you must activate a feature layer and choose the Search Active Layer tool from
the Quick Tools menu. Then type in a search term in the text box and press the
Enter key on your keyboard to run the tool. You can type in a partial search
term if you are not certain of the full term. For example a search of the California
Marine Protected Areas dataset for “reserve” returns all records with a value
of “State Marine Reserve”.
A
record for each of the features selected will be listed in the Table panel
along the bottom of the viewer. The corresponding features will be highlighted
yellow in the Map Canvas. Click on the Go button in the ZoomTo field to zoom to
a particular feature listed in the table.
- Locate Address Tool - Type a full or
partial street address, zip code, city or place name into the search box
and press the Enter key on your keyboard. A geocoding service will locate
the address entered on the map and the map will zoom to the location of
the closest match results.
![]()
Additional
Tools
Above
the map area and just below the banner and the Quick Tools
menu you will find additional tools grouped into two drop-down menus. These are
the Interactive Map Tools. and the Advanced Tools.
Interactive
Map Tools
Menu– These tools
interact directly with the map canvas. Select a tool from the drop-down menu
and click on the map to perform the desired task.

![]()
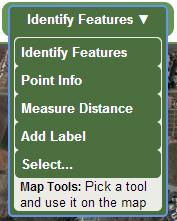
·
Identify
Features Tool - This is the default Interactive Map
Tool and also the most familiar to most users. Select the tool and click
on a feature in the Active Layer and the attribute data for the feature
identified is displayed in a pop-up Info Window.
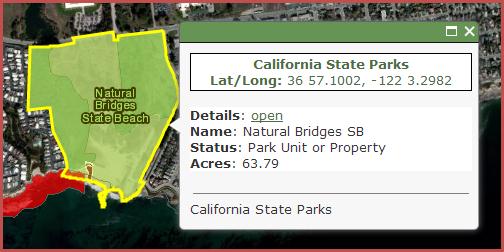
If
the Identify Features tool finds multiple features at a location a record for
each feature will be made available in the pop-up window.
Point
Info Tool - Select this tool
and click on the map to get some basic location information about a location in
the map.
NOTE: The basic geographic
reference information displayed below the potential street address found comes
from data layers limited by the California state boundary, so results may be
incomplete or unavailable if you click on a map point outside of California.
- Measure
Distance Tool
- This
tool allows you to perform length and area measurement within the Map
Canvas. As you select this tool a Measurement Tools menu will open in the
right panel of the viewer.
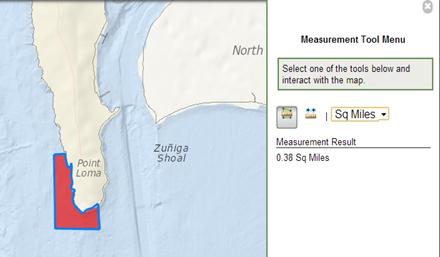
Select
either the Line Measurement tool or the Polygon measurement to and select the
measurement unit from the drop-down menu. As you click point in the Map Canvas
you will see you line or polygon drawn in blue. Measurement Results will be
displayed below the Measurement Tools in the right side panel of the viewer.
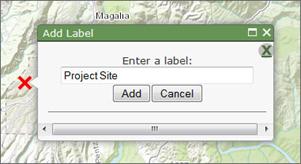
- Add Label Tool –
You can use this tool to click in the Map Canvas and manually place
labels. Select the Add Labels tool from the Interactive Tools menu, enter
your text in the pop-up box and click the Add button to place the label on
the map.
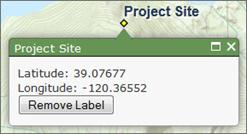
To
remove a label click on it and then click the Remove Label button in the pop-up
box.
To
remove all of your labels at once click on the Remove all Labels button in the Graphics
and Selections section of the Table of Contents.
![]()
![]()
- Select
Tool – When you choose
this tool from the Interactive Tools menu a panel will open on the right
side of the viewer offering you a choice of selection methods. Click on
the radio button to the left of the selection method that you would prefer
to use.
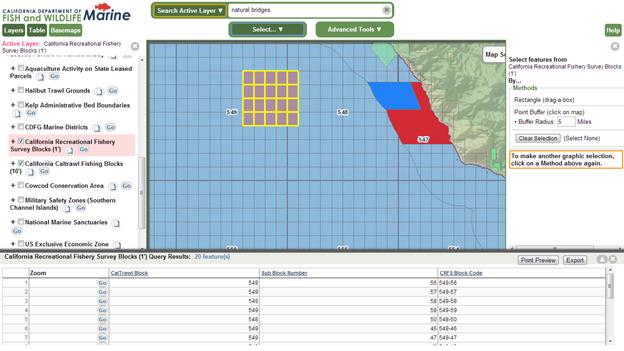
- The Rectangle (drag-a-box) option allows
you to select features from the Active Layer by using the mouse to click
on or to drag a box around features in the map. The selected features
will be highlighted yellow in the map and their attribute information
will appear in the Table panel at the bottom of the viewer window.
- The Point Buffer (click on map) option selects features from the Active Layer
that are within a distance of a point that you specify by clicking in the
map. You can adjust the size of the buffer that will be used to select
the features by changing the buffer radius before clicking in the map. The selected
features will be highlighted yellow in the map and their attribute
information will appear in the Table panel at the bottom of the viewer
window.
Advanced Tools Menu - These tools open a pop-up window requesting user input for more advanced analysis.
Tools such as the Query Builder tool, the Layer Filter tool and the Waypoint
tool can be found in this menu.
![]()
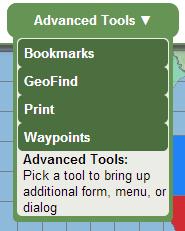
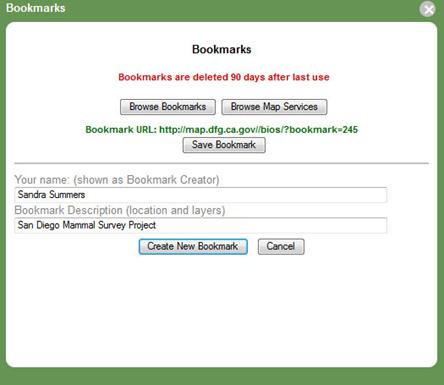
- Bookmarks
Tool - This tool saves
the location and layer information for the current map session. The bookmarked
BIOS map session can be reloaded at a later time or on a different
computer by using this tool or by opening the URL provided after the
Bookmark is created. The map extent, layer info (on/off, order, etc.), and
any labels that you have added to the map are all saved in the Bookmark.
![]()

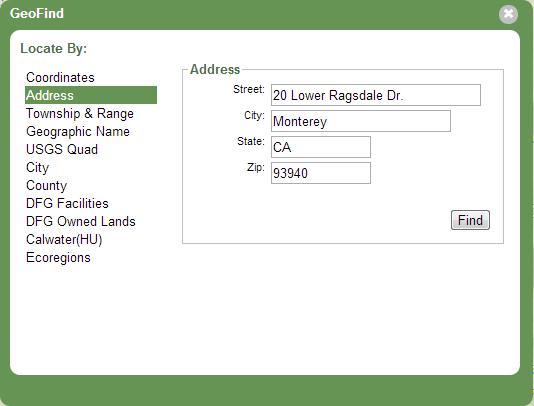
- GeoFind
Tool – This
tool provides a number of options for finding a location in the map.
o
Coordinates:
Find a location in the map by entering coordinates in Geographic (Latitude/Longitude)
or UTM formats. Click the Find button and the map will redraw zoomed in to the
specified location.
o
Address: This
option allows you to enter a partial or complete street address and zoom to it
in the map.
o
Township and
Range (PLSS): Select your Township, Range and Section values and
specify the appropriate meridian using the drop-down lists. When you click the
Find button a list of results matching your criteria will open in the Table.
You can zoom the map to one of the locations listed by
clicking the Go
button in the ZoomTo field.
o
Geographic Name: This
option will allow you to search for a place or geographic feature by searching
the USGS Geographic Names Information System (GNIS) database. This database
contains location references to all text that appears on all USGS quad maps. A record for each
result that matched your search criteria will be displayed in the Table panel
at the bottom of the viewer window. You can zoom the map to one of the
features listed by clicking the Go button in the
ZoomTo field.
o
USGS Quad –
Choose from a list of 1:24,000-scale (24K), 7.5-minute by 7.5-minute Quadrangle
maps from the U.S. Geological Survey and zoom to the boundary of the specified
Quad.
o
City –
Select a city of interest from the drop-down list provided and zoom to it by
clicking the Find button.
o
County –
Select a county of interest from the drop-down list provided and zoom to it by
clicking the Find button.
o
DFG Facilities –
Choose from a drop-down list of California Department of Fish and Wildlife
offices and facility locations and zoom to it by clicking the Find button.
o
DFG Owned Lands –
Choose from a drop-down list of properties that are owned and/or administered
by the California Department of Fish and Wildlife. Click the Find button to
redraw the map zoomed in to the specified property.
o
Calwater(HU) –
Use this option to select a watershed boundary at the Hydrologic Unit (HU,
major rivers) level from a list compiled from the California Interagency
Watershed Map. Click the Find button to
zoom the map in to the specified Hydrologic Unit.
o
Ecoregions –
Use this option to select an Ecoregion from a list derived from Ecological Unit
Sections for the state of California as described by ECOMAP (1993), United States
Department of Agriculture, Forest Service. Click the
Find button to zoom the map in to the specified Ecoregion.
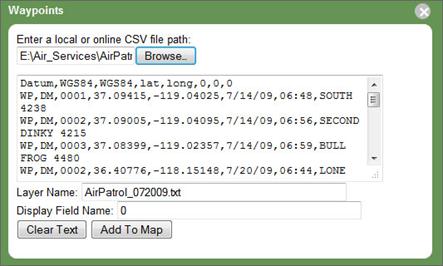
- Waypoints
Tool - you
can load your GPS waypoints into the map using the Waypoints tool in the
Advanced Tools drop-down menu. They must be stored in a comma separated
values (CSF) format on your computer in order for the tool to load them.